It is 3am.
The alert says the API is flapping.
kubectl get pods shows the pod is running now, but the restart count keeps climbing. You check the logs and they look clean because the current container already restarted. The useful evidence was in the previous container.
This is the moment where OOMKilled feels more confusing than it actually is.
Kubernetes is telling you that a container was terminated because of memory. The hard part is proving which memory boundary was involved, whether the workload is leaking, whether the limit is simply too low, or whether the node itself is under pressure.
This guide gives you the incident path I would use before changing a manifest.
For the Kubernetes basics behind Pods, Deployments, Services, and debugging commands, start with Kubernetes Fundamentals. For sizing the resource numbers once you know what to change, use the Kubernetes Resource Calculator.
What OOMKilled Means
OOMKilled means a container was terminated after running out of memory.
In Kubernetes, memory is different from CPU:
- CPU can be throttled when a container hits its CPU limit.
- Memory cannot be throttled in the same simple way.
- If a container uses more memory than its memory limit, it can be killed.
- If the node runs out of memory before the kubelet can reclaim enough memory, the Linux OOM killer can select a container to terminate.
The official Kubernetes memory resource guide shows the simplest version: a container with a 100Mi memory limit tries to allocate more than that, the container terminates with reason OOMKilled, and the terminated state shows exit code 137.
That does not automatically mean "raise the limit and move on."
It means you should answer five questions:
- Which container was killed?
- Was it killed for exceeding its own limit?
- Was the node under memory pressure?
- Did the application leak memory or spike normally?
- Are the requests, limits, replicas, and node capacity aligned?
Fast Triage Checklist
I run these first during an incident.
kubectl get pods -n <namespace>
kubectl describe pod <pod-name> -n <namespace>
kubectl logs <pod-name> -n <namespace> --previous
kubectl top pod <pod-name> -n <namespace>
kubectl top nodes
kubectl describe node <node-name>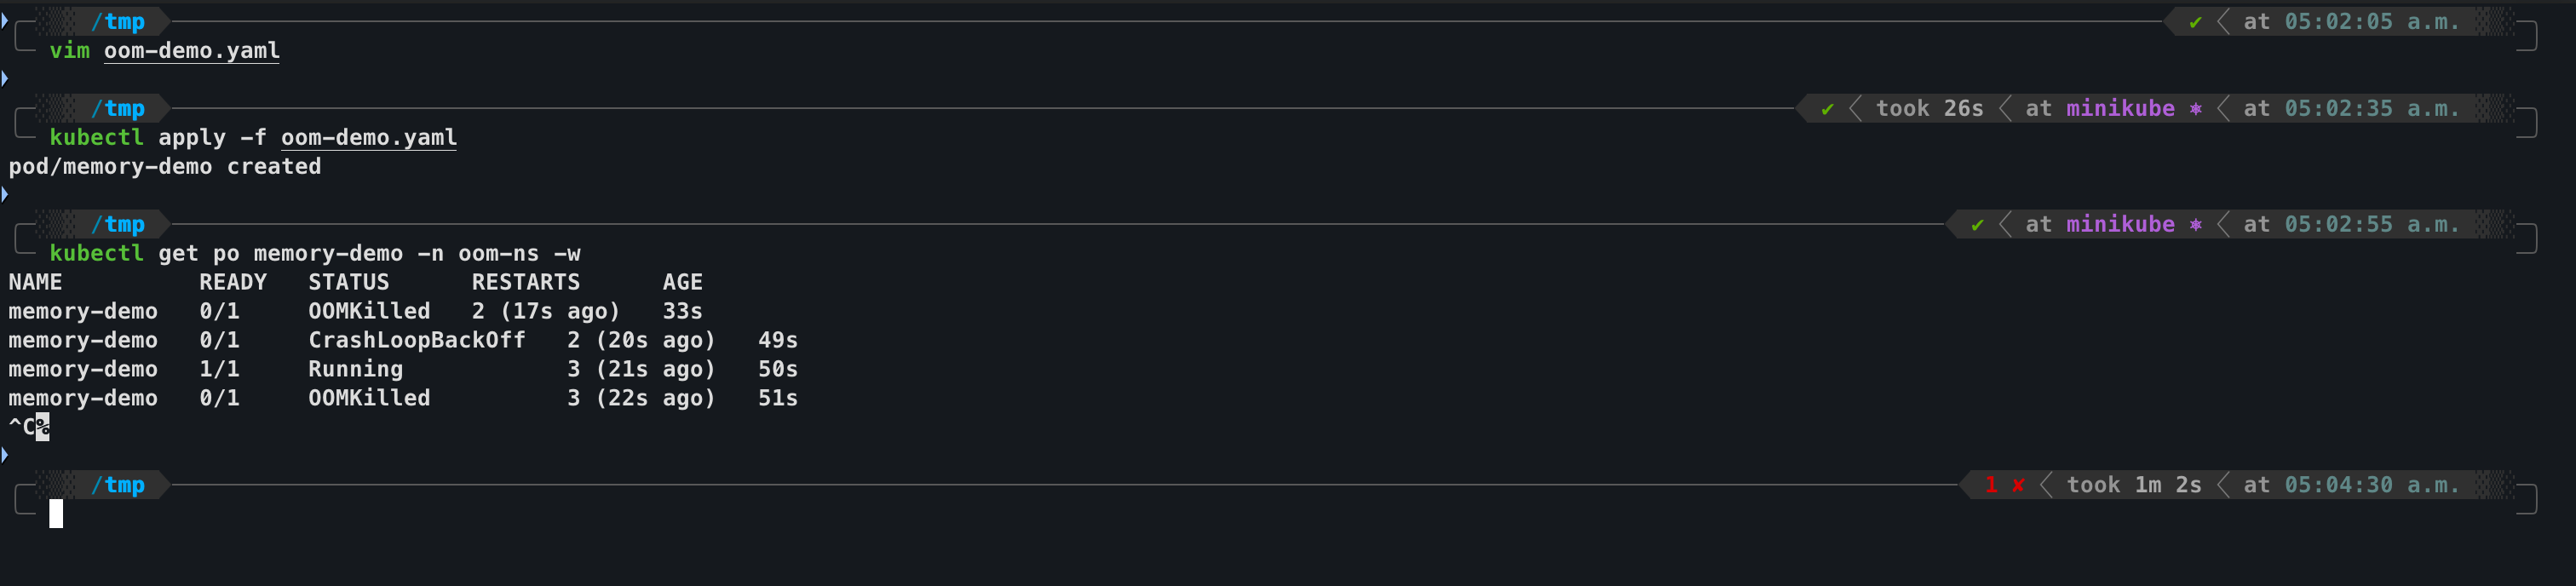
What you are looking for:
| Signal | Where to look | Meaning |
|---|---|---|
Restart Count increasing | kubectl describe pod | The container has restarted before |
Last State: Terminated | kubectl describe pod | The previous container exit details |
Reason: OOMKilled | kubectl describe pod or pod YAML | The previous container was killed for memory |
Exit Code: 137 | kubectl describe pod or pod YAML | Common OOM termination signal |
BackOff event | kubectl describe pod events | Kubernetes is delaying repeated restarts |
| high live memory | kubectl top pod | Current container may be near the same failure |
MemoryPressure | kubectl describe node | The node is under memory pressure |
If kubectl top is unavailable, your cluster may not have a provider for the Kubernetes Metrics API installed. The official memory assignment tutorial uses kubectl get apiservices to check whether metrics.k8s.io is available.
kubectl get apiservicesLook for:
v1beta1.metrics.k8s.ioStep 1: Confirm the Container That Died
I start with describe, not a manifest diff.
kubectl describe pod <pod-name> -n <namespace>In a single-container pod, the culprit is obvious. In a multi-container pod, check each container block.
Look for this shape:
Containers:
  api:
    State:          Running
    Last State:     Terminated
      Reason:       OOMKilled
      Exit Code:    137
    Restart Count:  5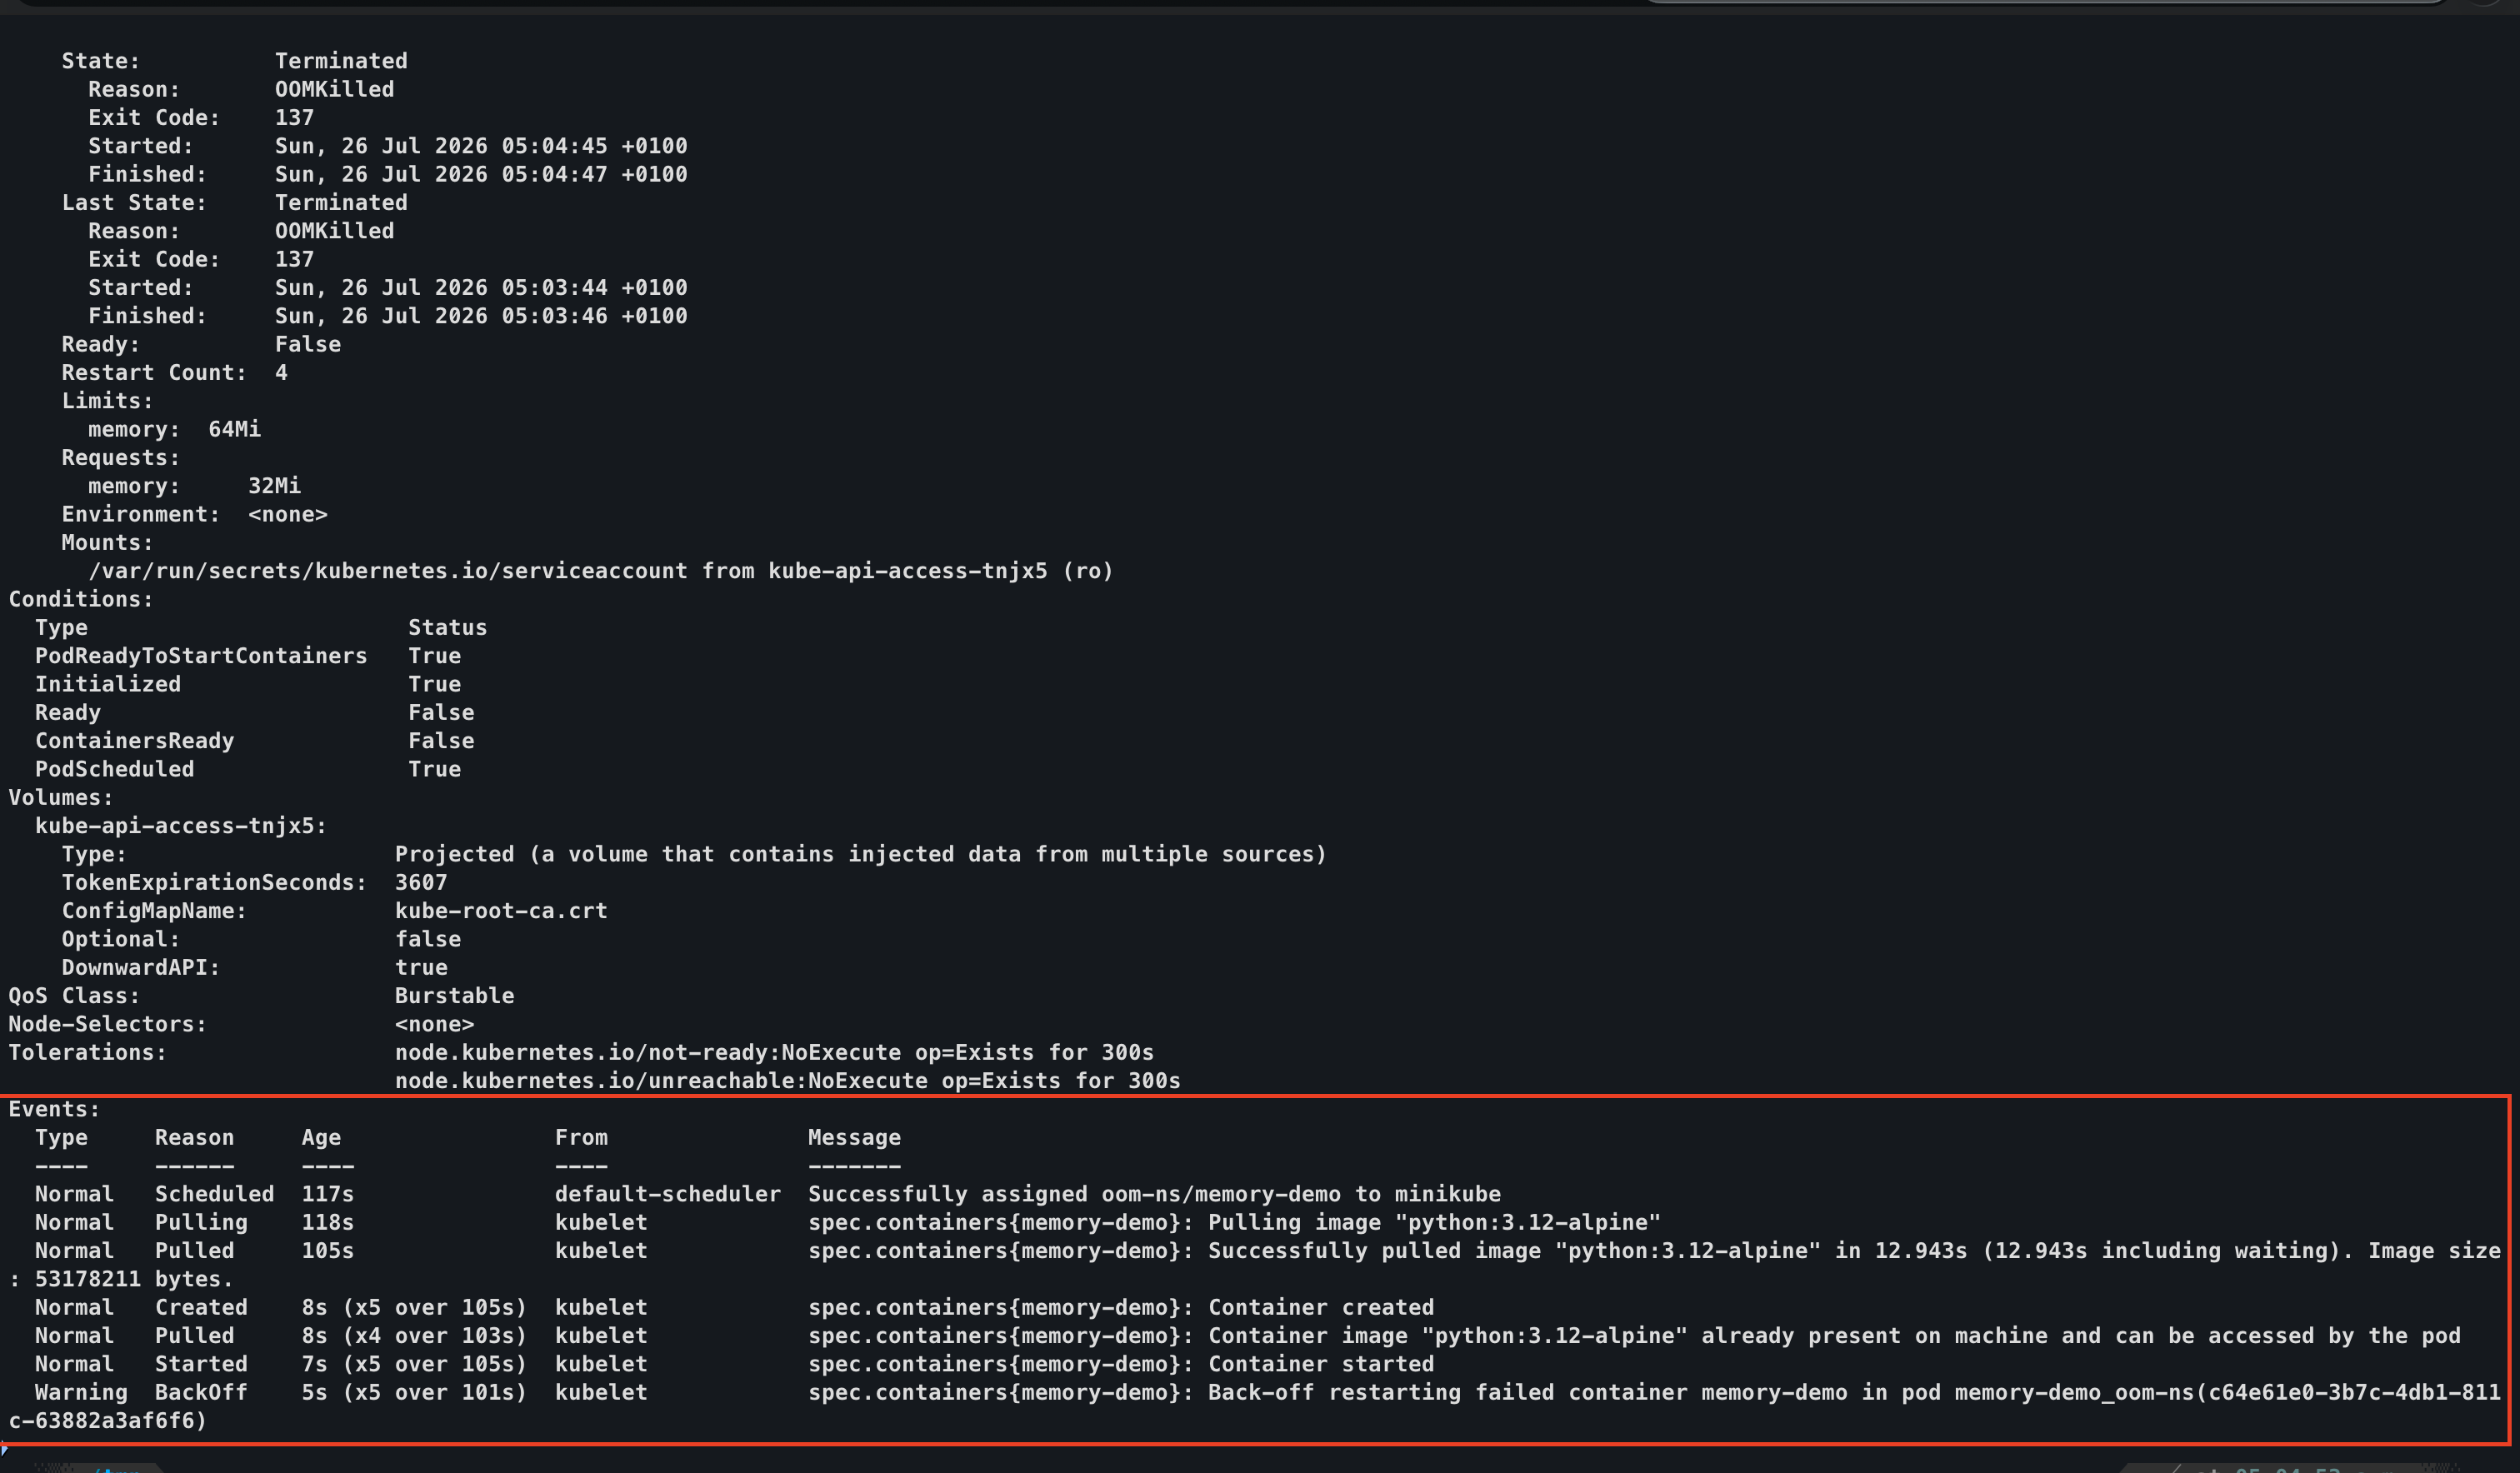
The current State can be Running because Kubernetes already restarted the container. The important evidence is in Last State.
If the pod is managed by a Deployment, do not edit the pod directly. Fix the Deployment, Helm values, Kustomize patch, or GitOps source that owns the pod template.
To identify the owner:
kubectl get pod <pod-name> -n <namespace> -o jsonpath='{.metadata.ownerReferences[*].kind}{" "}{.metadata.ownerReferences[*].name}{"\n"}'Step 2: Read the Previous Logs
After a restart, normal kubectl logs shows the current container. For a crash that already happened, use --previous.
kubectl logs <pod-name> -n <namespace> --previousFor a specific container:
kubectl logs <pod-name> -n <namespace> -c <container-name> --previousThe official Kubernetes debugging guide calls out --previous for containers that have already crashed. For OOMKilled, this matters because the application may have logged the last request, batch job, queue message, startup path, or cache warmup that pushed memory over the line.
If previous logs are empty, that is also useful. A process can be killed before it flushes logs, especially during fast memory growth.

Step 3: Check the Resource Requests and Limits
Now inspect the actual resources on the live pod.
kubectl get pod <pod-name> -n <namespace> -o jsonpath='{range .spec.containers[*]}{.name}{"\nrequests: "}{.resources.requests}{"\nlimits: "}{.resources.limits}{"\n\n"}{end}'You want to know:
- Is there a memory limit?
- Is the limit lower than the workload's normal peak?
- Is the request much lower than real usage?
- Is the pod using a namespace default from a
LimitRange?
Kubernetes uses requests and limits differently:
- A memory request is what the scheduler uses when placing the pod on a node.
- A memory limit is the hard ceiling the container is allowed to use.
- If a memory limit exists and the container exceeds it, the container can be terminated.
Example Deployment fragment:
apiVersion: apps/v1
kind: Deployment
metadata:
  name: api
spec:
  template:
    spec:
      containers:
        - name: api
          image: ghcr.io/example/api:1.4.2
          resources:
            requests:
              cpu: '250m'
              memory: '256Mi'
            limits:
              cpu: '500m'
              memory: '512Mi'
If the application normally peaks at 700Mi, this 512Mi limit is a problem. If it normally sits at 220Mi and slowly climbs until it dies, that points toward a leak or unbounded cache.
Step 4: Compare Current Usage With the Limit
I use live metrics if the pod is currently running again.
kubectl top pod <pod-name> -n <namespace> --containersThen I I compare current memory against the configured limit.
If the container is already near its limit minutes after restart, treat the incident as active. I capture logs, current memory, traffic context, and recent deploy information before changing anything.
If the container is far below the limit now, the kill may have come from a burst:
- startup loading too much data
- a large request payload
- a batch job with an unusually large input
- a cache warming path
- a dependency retry storm
- a traffic spike
The fix depends on which pattern you prove.
Step 5: Check Whether the Node Was Under Memory Pressure
Container-level OOM and node-pressure eviction are related, but they are not the same investigation.
Find the node:
kubectl get pod <pod-name> -n <namespace> -o wideThen I I describe it:
kubectl describe node <node-name>Look for conditions and events mentioning memory pressure or OOM.
The official node-pressure eviction documentation says the kubelet monitors node resources such as memory, disk, and process IDs. When thresholds are met, the kubelet can terminate pods to reclaim resources. If the node hits an OOM event before the kubelet reclaims memory, the Linux OOM killer responds, and the kubelet may restart the container according to the pod's restartPolicy.
That distinction matters:
- If the container exceeded its own memory limit, fix the workload limit or memory behavior.
- If the node was under pressure, check node allocatable capacity, pod density, requests, DaemonSets, and other noisy workloads on the same node.
Step 6: Check QoS Class Before Blaming the App
Kubernetes assigns pods one of three Quality of Service classes:
| QoS class | Typical resource shape | Eviction behavior under node pressure |
|---|---|---|
Guaranteed | Every container has CPU and memory request equal to limit | Its usage does not exceed requests, so it is considered in the final eviction tier alongside Burstable pods using below their requests |
Burstable | Has at least one CPU or memory request or limit, but does not meet Guaranteed criteria | Considered earlier when usage exceeds requests; below-request pods share the final tier with Guaranteed pods |
BestEffort | No CPU or memory requests or limits | Generally considered before Burstable and Guaranteed pods under node pressure |
I check it:
kubectl get pod <pod-name> -n <namespace> -o jsonpath='{.status.qosClass}{"\n"}'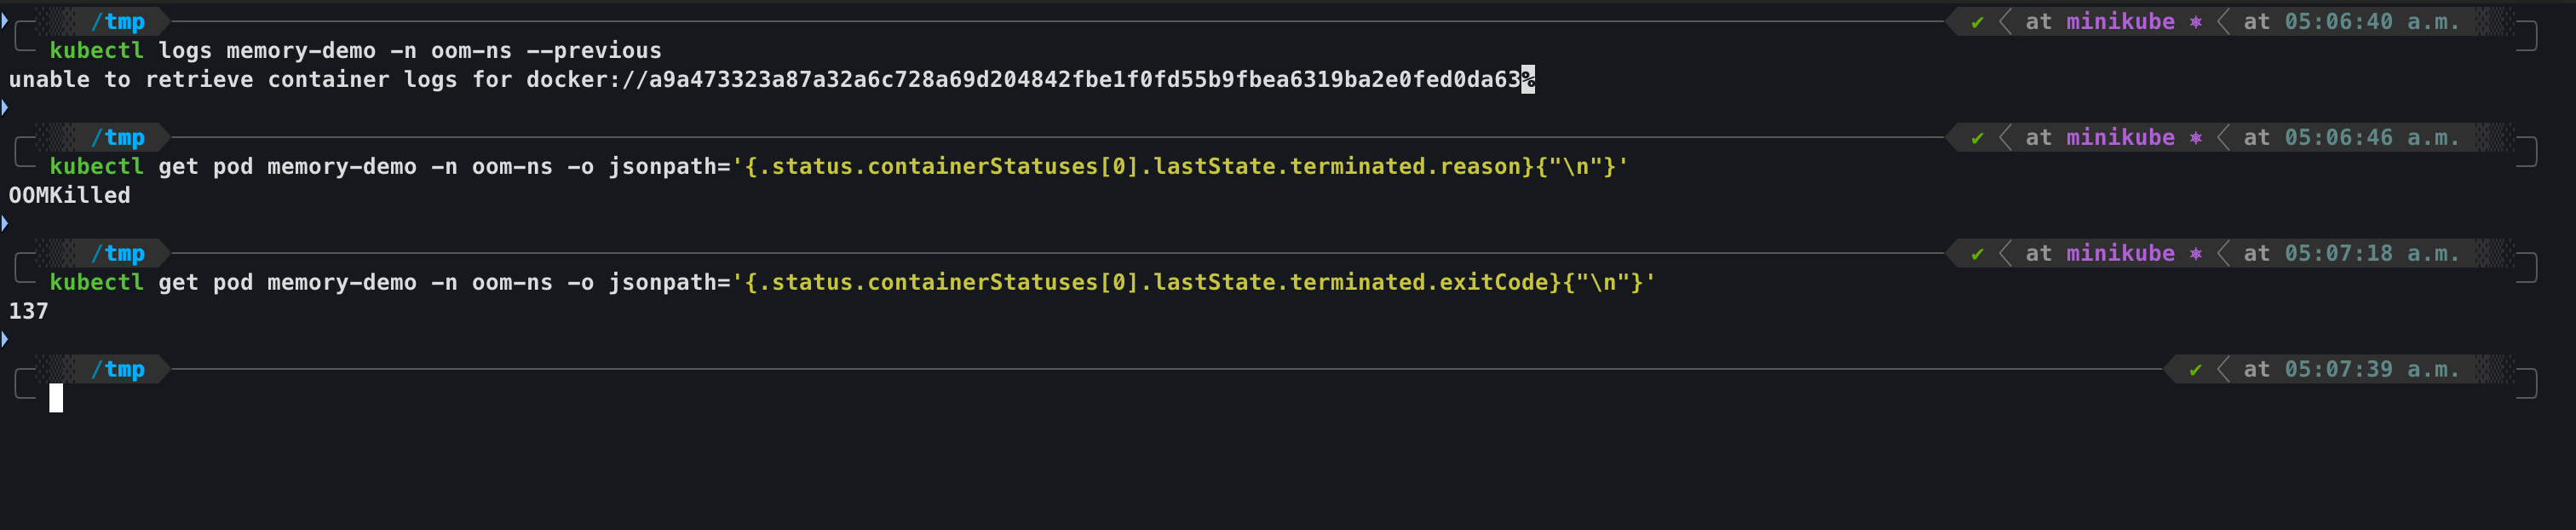
QoS does not make a memory leak safe. A Guaranteed pod can still be killed if it exceeds its own limit. During memory pressure, QoS class alone does not determine eviction order: the kubelet first considers whether usage exceeds requests, then Pod Priority, then how far usage exceeds requests relative to the pod's request. That means a Burstable pod using below its requests can share the final eviction tier with Guaranteed pods.
Step 7: Check Namespace Defaults
Sometimes the memory limit did not come from the application manifest at all.
I check for LimitRange objects:
kubectl get limitrange -n <namespace>
kubectl describe limitrange -n <namespace>
A namespace can apply default memory requests and limits. That is useful for guardrails, but it can surprise you if a workload has no explicit resources and silently receives a default that is too small.
If the pod has a limit you cannot find in the Deployment manifest, check namespace defaults before chasing the wrong source file.
Step 8: Decide the Correct Fix
I do not fix every OOMKilled by doubling memory.
I use the evidence to choose the smallest honest fix.
| Evidence | Likely cause | Better fix |
|---|---|---|
| memory climbs steadily until killed | leak or unbounded cache | fix code, cap cache, profile heap |
| memory jumps during startup | startup allocation too high | reduce startup load or raise limit based on measured peak |
| memory jumps during one job/request | large input or batch size | stream data, reduce batch size, enforce request limits |
| many pods on node near request but over actual capacity | under-requested workloads | raise requests, reduce pod density, add capacity |
| pod receives unexpected default limit | namespace LimitRange | set explicit resources or adjust default policy |
node shows MemoryPressure | node-level pressure | inspect other pods, DaemonSets, allocatable memory, and scheduling |
If the limit really is too low, update the owning workload.
kubectl set resources deployment/api \
  -n production \
  -c api \
  --requests=cpu=250m,memory=512Mi \
  --limits=cpu=500m,memory=1Gi
For GitOps or infrastructure-as-code environments, use this only as an emergency change if your process allows it. The permanent fix belongs in the source of truth.
If you are using manifests:
resources:
  requests:
    cpu: '250m'
    memory: '512Mi'
  limits:
    cpu: '500m'
    memory: '1Gi'
Then I I roll it out:
kubectl apply -f deployment.yaml
kubectl rollout status deployment/api -n production
Step 9: Watch the Replacement Pods
After a fix, verify the behavior. A successful rollout only proves Kubernetes accepted the new desired state; it does not prove the memory pattern is healthy.
kubectl rollout status deployment/api -n production
kubectl get pods -n production -l app=api
kubectl top pod -n production -l app=api --containers
kubectl describe pod <new-pod-name> -n production
Watch for:
- restart count staying at zero
- memory stabilizing below the limit
- readiness remaining healthy
- no new
BackOffevents - no node
MemoryPressure
If the pod still dies, keep the evidence from before and after the change. The delta tells you whether you raised the limit enough to mask the symptom or whether the application continues growing without bound.
Practical OOMKilled Runbook
I use this when your brain is tired and the pager is loud.
# 1. Find restart loops
kubectl get pods -n <namespace>

# 2. Read container state, last state, restarts, limits, node, and events
kubectl describe pod <pod-name> -n <namespace>

# 3. Read logs from the previous container instance
kubectl logs <pod-name> -n <namespace> --previous

# 4. Check current memory usage, if metrics are available
kubectl top pod <pod-name> -n <namespace> --containers

# 5. Find the node
kubectl get pod <pod-name> -n <namespace> -o wide

# 6. Check node pressure and OOM events
kubectl describe node <node-name>

# 7. Check QoS
kubectl get pod <pod-name> -n <namespace> -o jsonpath='{.status.qosClass}{"\n"}'

# 8. Check namespace defaults
kubectl get limitrange -n <namespace>

# 9. Fix the owning workload, then watch rollout and memory
kubectl rollout status deployment/<deployment-name> -n <namespace>
kubectl top pod -n <namespace> -l app=<label> --containers
Common Mistakes
- Reading only current logs and missing
kubectl logs --previous. - Raising memory limits without checking whether memory grows steadily over time.
- Forgetting that requests affect scheduling, while limits affect runtime enforcement.
- Setting memory as
400mwhen you meant400Mi; Kubernetes memory quantities are case-sensitive. - Debugging the pod object instead of the Deployment, Helm chart, Kustomize overlay, or GitOps repository that owns it.
- Ignoring node pressure and assuming every OOM is caused by the one container that restarted.
- Leaving workloads with no explicit resources and relying on namespace defaults you have not checked.
How to Prevent the Next OOMKilled Incident
Prevention is not about picking one magic memory number. It is about making memory behavior observable and intentional.
I use this baseline:
- Set explicit memory requests and limits for every production container.
- Size requests from normal steady-state usage, not hopeful guesses.
- Size limits from measured peak usage plus a buffer the application can justify.
- I keep request and limit close for latency-sensitive services where eviction predictability matters.
- I add application-level limits for caches, queues, batch sizes, and upload sizes.
- Alert on restart count changes, not only pod availability.
- I review node memory pressure, not just pod memory.
- I use the Kubernetes Resource Calculator when you need to multiply one pod's resources across replicas.
If you are learning the broader Kubernetes debugging workflow, the Production-Ready AKS GitOps with Terraform and ArgoCD project shows how these failures fit into real deployment operations.
Final Takeaway
OOMKilled is not a vague Kubernetes mood.
It is evidence.
Read it in order: pod state, previous logs, limits, live metrics, node pressure, QoS, namespace defaults, then the owning workload.
Read the full OOMKilled troubleshooting walkthrough on CloudTechByVictor.com and bookmark it for the next time a pod restarts at 3am and you are too tired to remember the right kubectl flags.
References
- Kubernetes Documentation - Resource Management for Pods and Containers
- Kubernetes Documentation - Assign Memory Resources to Containers and Pods
- Kubernetes Documentation - Debug Running Pods
- Kubernetes Documentation - Pod Lifecycle
- Kubernetes Documentation - Pod Quality of Service Classes
- Kubernetes Documentation - Node-pressure Eviction